
What the waste factor hid
Across six contractors in Korea we reconciled 2D takeoff quantities against 3D model quantities. On reinforcement the gap ran from −8.3% to +6.0%. The prescribed waste factor is 3% in Korea and 4% in Japan. Neither covers that spread.
Published August 24, 2026·Last checked · August 2026
Key points
- The waste factor differs by country — Korea's Standard Estimating Manual sets 3% for deformed bar, Japan's public standard 4%. Yet the measured gap runs −8.3% to +6.0%, outside either figure
- Tracing every item of difference and aligning the takeoff rules on both sides halved the error. One building moved from −8.34% to +0.52% — the quantity did not change, it was counted again by the same rule
- The gap splits three ways — rule difference (can be agreed), omission (nothing to agree about), takeoff error. Quite different in kind, yet they mix in the total and sometimes cancel each other
- One typical floor: 1.487 t. Floors repeat, so across six blocks that is 428 t — 3.5% of the total execution quantity
1First, what the waste factor is
Bar arrives in set lengths — 8 m, 10 m. The lengths needed vary, so every cut leaves a remnant. And as Part 1 showed, the drawing alone cannot fix every length. So a fixed ratio is added to the design quantity. That is the waste factor.
How large that ratio is differs by country.
| Standard | Reinforcement | Notes |
|---|---|---|
| Korea Standard Estimating Manual Ch.1 · 5. Steel | deformed bar 3% plain bar 5% | 6–7% for main bars in bridges, subways and similar complex structures. “For deformed bar it may be adjusted to the record of the works or structure.” |
| Japan Public Building Quantity Takeoff Standard 2023 revision | 4% | required quantity = design quantity × 1.04 |
2Six projects, numbers all over the place
This is our own reconciliation across six contractors in Korea. Company and project names are not disclosed. Both sides were compared on identical terms, waste factor included.
| Case | Concrete | Formwork | Reinforcement |
|---|---|---|---|
| Housing A | −0.8% | +0.2% | +1.7% |
| Housing B | +2.7% | +0.6% | +6.0% |
| Housing C | +2.9% | +2.1% | +0.8% |
| Housing D (block 101) | — | — | −8.3% |
| Housing E | −1.0% | +1.6% | −4.3% |
| Mixed-use F | −1.1% | +1.7% | −3.1% |
The numbers scatter. From −8.3% to +6.0%. Neither 3% nor 4% covers that. What to read here is not “3D comes out a few percent lower.” It is that no single waste factor can meet this spread.
3Align the rules and the gap narrows
First, what does not match what. We reconciled the 2D takeoff the contractor was using against a 3D model built from the same drawings.
This is where most comparisons stop — at “they still don't match.” But not matching and being wrong are different things. The two values were counted by different rules from the start: where bars are spliced, how development and cover are treated, how the count is arrived at.
So what we did came next. We traced every item of difference to the end and aligned the takeoff rules on both sides. Nothing about the quantity was corrected — only the rule for counting was matched — so whatever remains is the real difference that the rules cannot explain.
| Case | Before | After |
|---|---|---|
| Reinforcement | 8.26% | 3.23% |
| Concrete | 2.98% | 1.56% |
| Formwork | 3.99% | 1.90% |
| Housing D (reinforcement, block 101) | −8.34% | +0.52% |
The first three rows are the magnitude of the gap by trade; the last row follows one building (Housing D, block 101) with its sign.
−8.34% becomes +0.52%. The quantity did not change.
It was counted again by the same rule. The first 8% was not “wrong” — it was “counted by a different rule.”
4The gap splits three ways
What “traced to the end” means shows up in one project's record. A single lump of difference was split into rule difference · omission · takeoff error, with the amount for each.
| Trade | Rule difference | Omission | Takeoff error | Total | Total (%) |
|---|---|---|---|---|---|
| Concrete (m³) | +2,294.90 | −3,018.58 | — | −723.68 | −0.56% |
| Formwork (m²) | −34.42 | −5,835.71 | — | −5,870.28 | −0.87% |
| Reinforcement (t) | −657.38 | +61.81 | −43.08 | −638.65 | −4.01% |
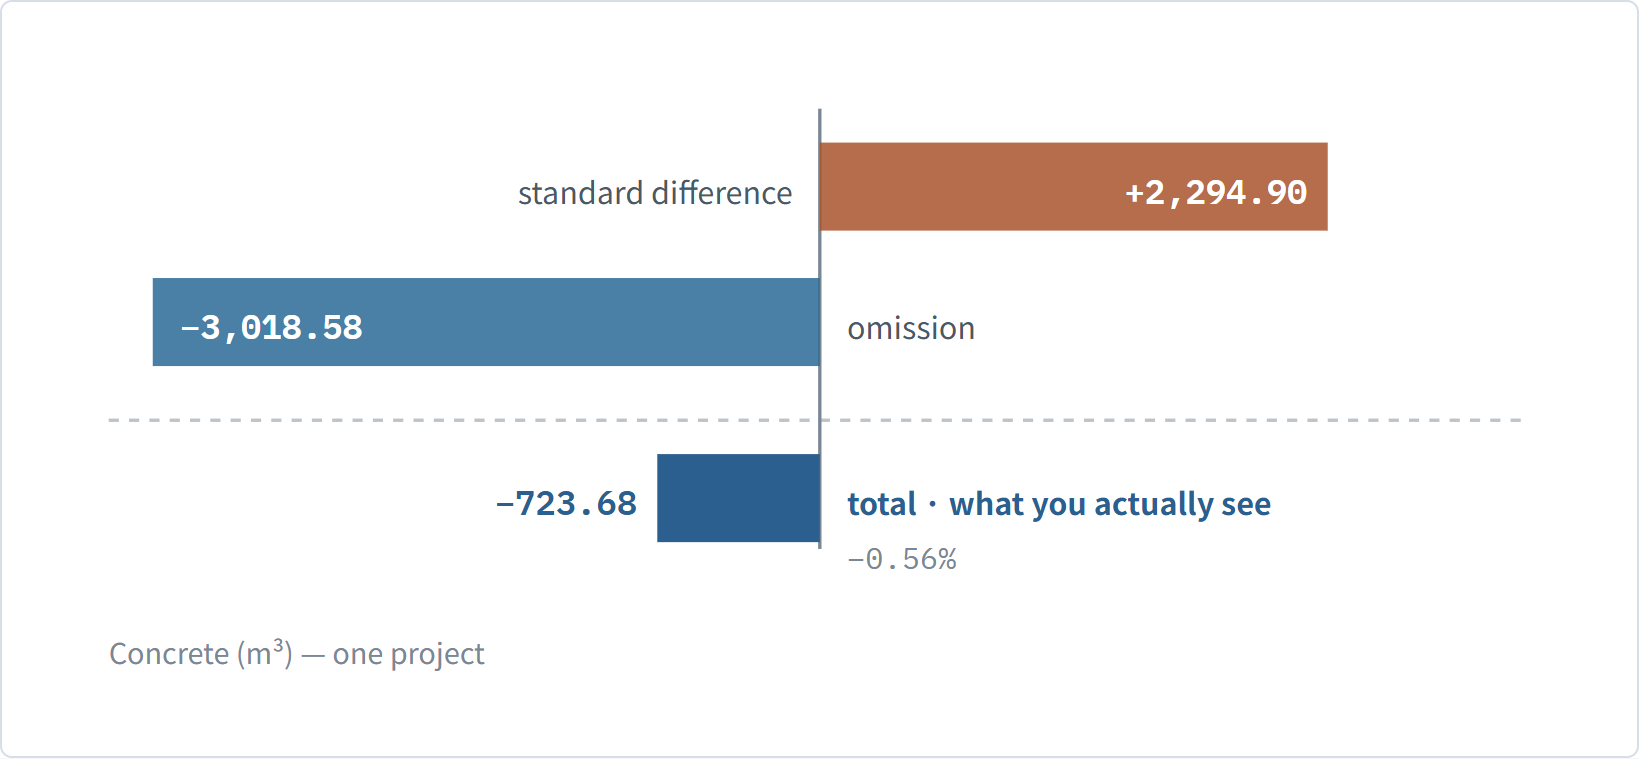
- Rule difference — a gap from differing takeoff rules. It can be explained, and agreed.
- Omission — quantity never counted. On formwork, −5,836 m² of the −5,870 m² total was omission. There is nothing to agree about.
- Takeoff error — the rule itself applied wrongly.
5When the drawing and the schedule already disagree
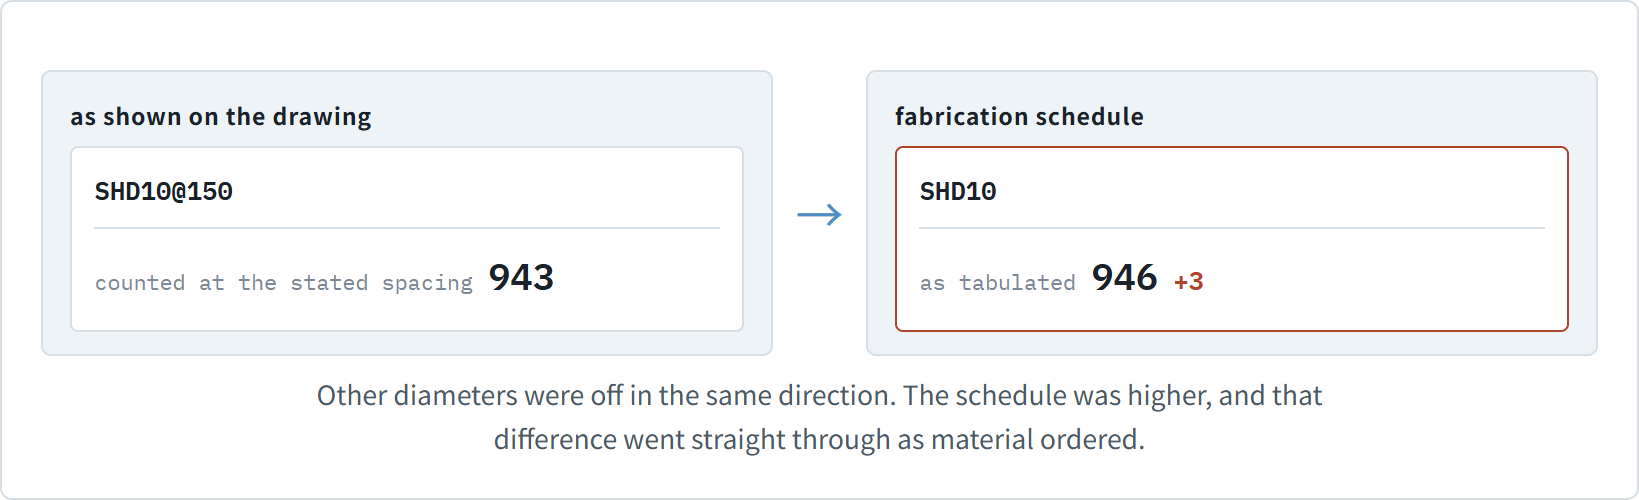
Other diameters were off the same way. The schedule was higher, and that difference went straight into the order.
61.487 tonnes on a single floor
This is one typical floor, reconciled. Whether support bars and spacers were counted, foundation support reinforcement, the diameter of the bathroom step reinforcement, lap lengths on the main bars — no single item reaches a tonne.
one typical floor, reconciled
1.487t
floors 2–49 · six blocks
428t
of 12,370 t total execution quantity
3.5%
No single item looks serious. The floor count multiplies it.
7Why no one looked until now
It was never a technology problem. It is a structural one.
The rebar quantity is decided again at each step down the chain — head office sets the execution budget and passes it to the site office; the site office fixes the placing policy and hands it to the rebar shop; the shop produces the fabrication schedule for the fabrication yard; the yard delivers fabricated bar to the site and frame subcontractor.
And here the interests diverge. Upstream keeps more when less steel is used; downstream keeps more when more is used. Opposite directions within one chain — with no baseline to check either against.
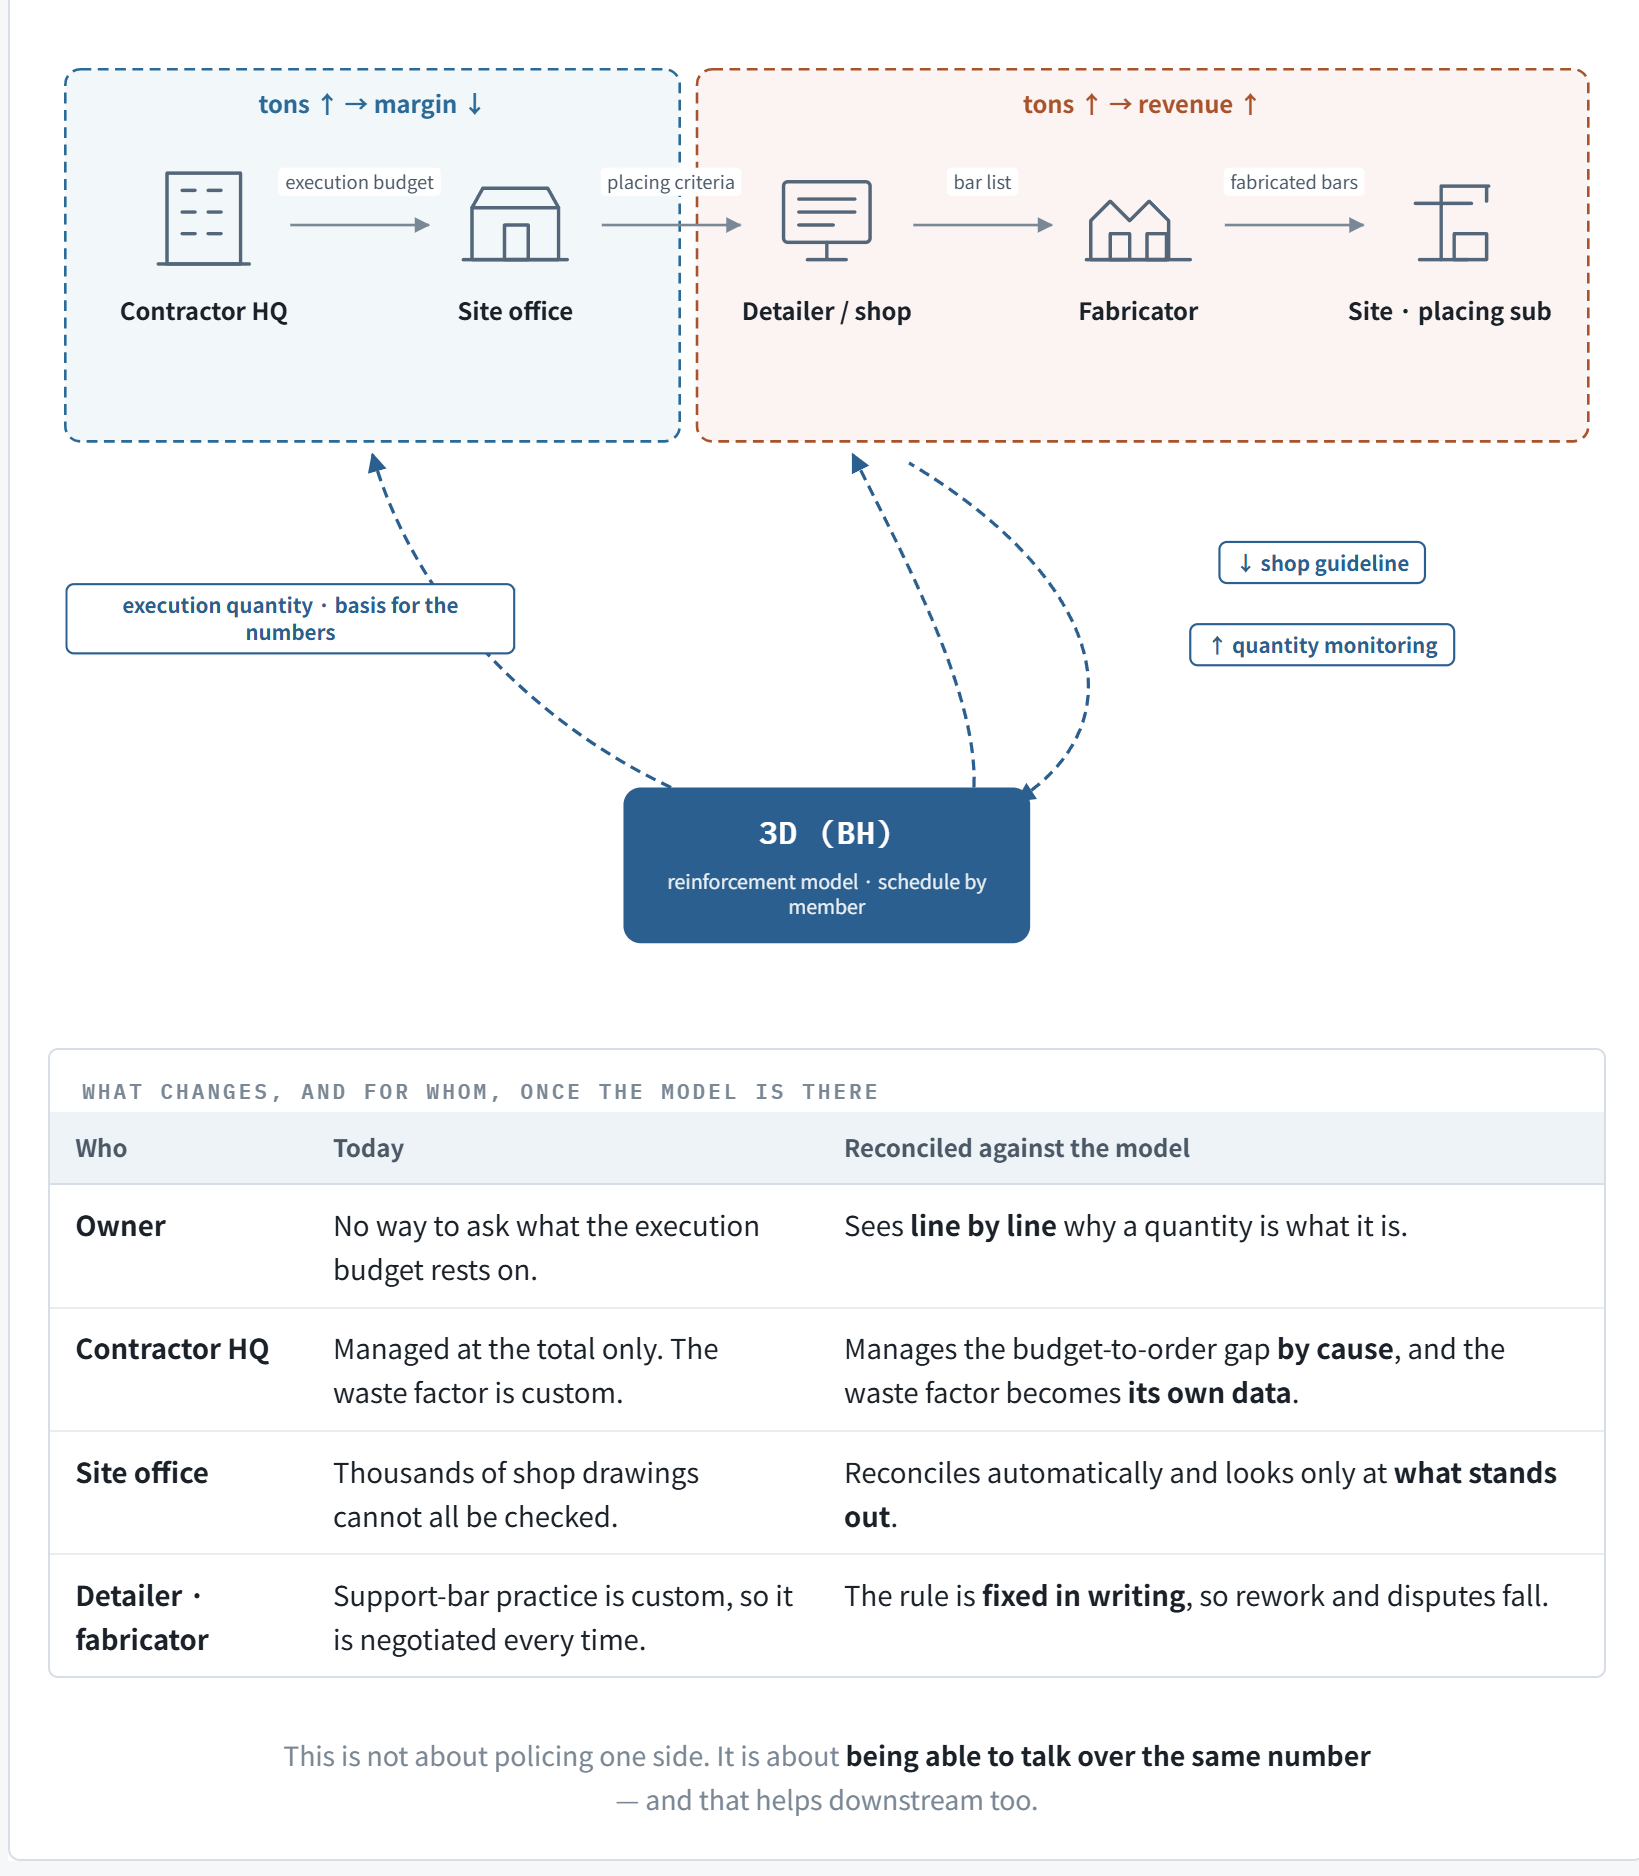
One residential floor takes more than 10,000 bars. The shop drawings run to thousands of sheets. When a quantity jumps, finding the reason across those sheets is not work a person can do.
8What changes when the model is there
A 3D model is different. Place a member and it gets reinforced; that reinforcement lands in the schedule. To miss it the member has to be gone altogether — and then the gap is plain to see.
| Who | Today | With the model to check against |
|---|---|---|
| Client | No means to ask what the execution budget rests on. | Confirms line by line why the quantity is what it is. |
| Contractor head office | Manages by totals only. The waste factor is custom. | Manages the gap between budget and order by cause, and the waste factor becomes its own data. |
| Site office | Cannot review thousands of shop drawings. | Checks against the model automatically and looks only at what stands out. |
| Rebar shop · yard | Support-steel practice is custom, so it is negotiated every time. | The rule is fixed in writing, cutting rework and disputes. |
The value of a 3D model is not in reducing the quantity.
It is in being able to say whether it went up or down, and why.
Sources
- Standard Estimating Manual — Ch.1 “5. Steel” (deformed bar 3%, plain bar 5%)MOLIT · KICT, Korea
- Public Building Quantity Takeoff Standard (2023 revision) — a 4% addition is standard for reinforcementMLIT, Japan
- Part 1 — Why reinforcement is hard to countChangSoft Global
- BuilderHub-R product overviewChangSoft Global
This article is a summary compiled from published material. It is not a legal interpretation and does not constitute advice. Regulation changes frequently, so please check the original documents and the latest notices from the responsible authority before relying on it in practice.