
Fewer people left to read the drawings
A drawing speaks in symbols, and a symbol only works once someone reads it. That premise is breaking down, measurably. This article sizes it first, then shows what it looks like on site.
Published August 20, 2026·Last checked · August 2026
Key points
- In the US, 92% of construction firms report difficulty hiring (AGC · NCCER, 2025)
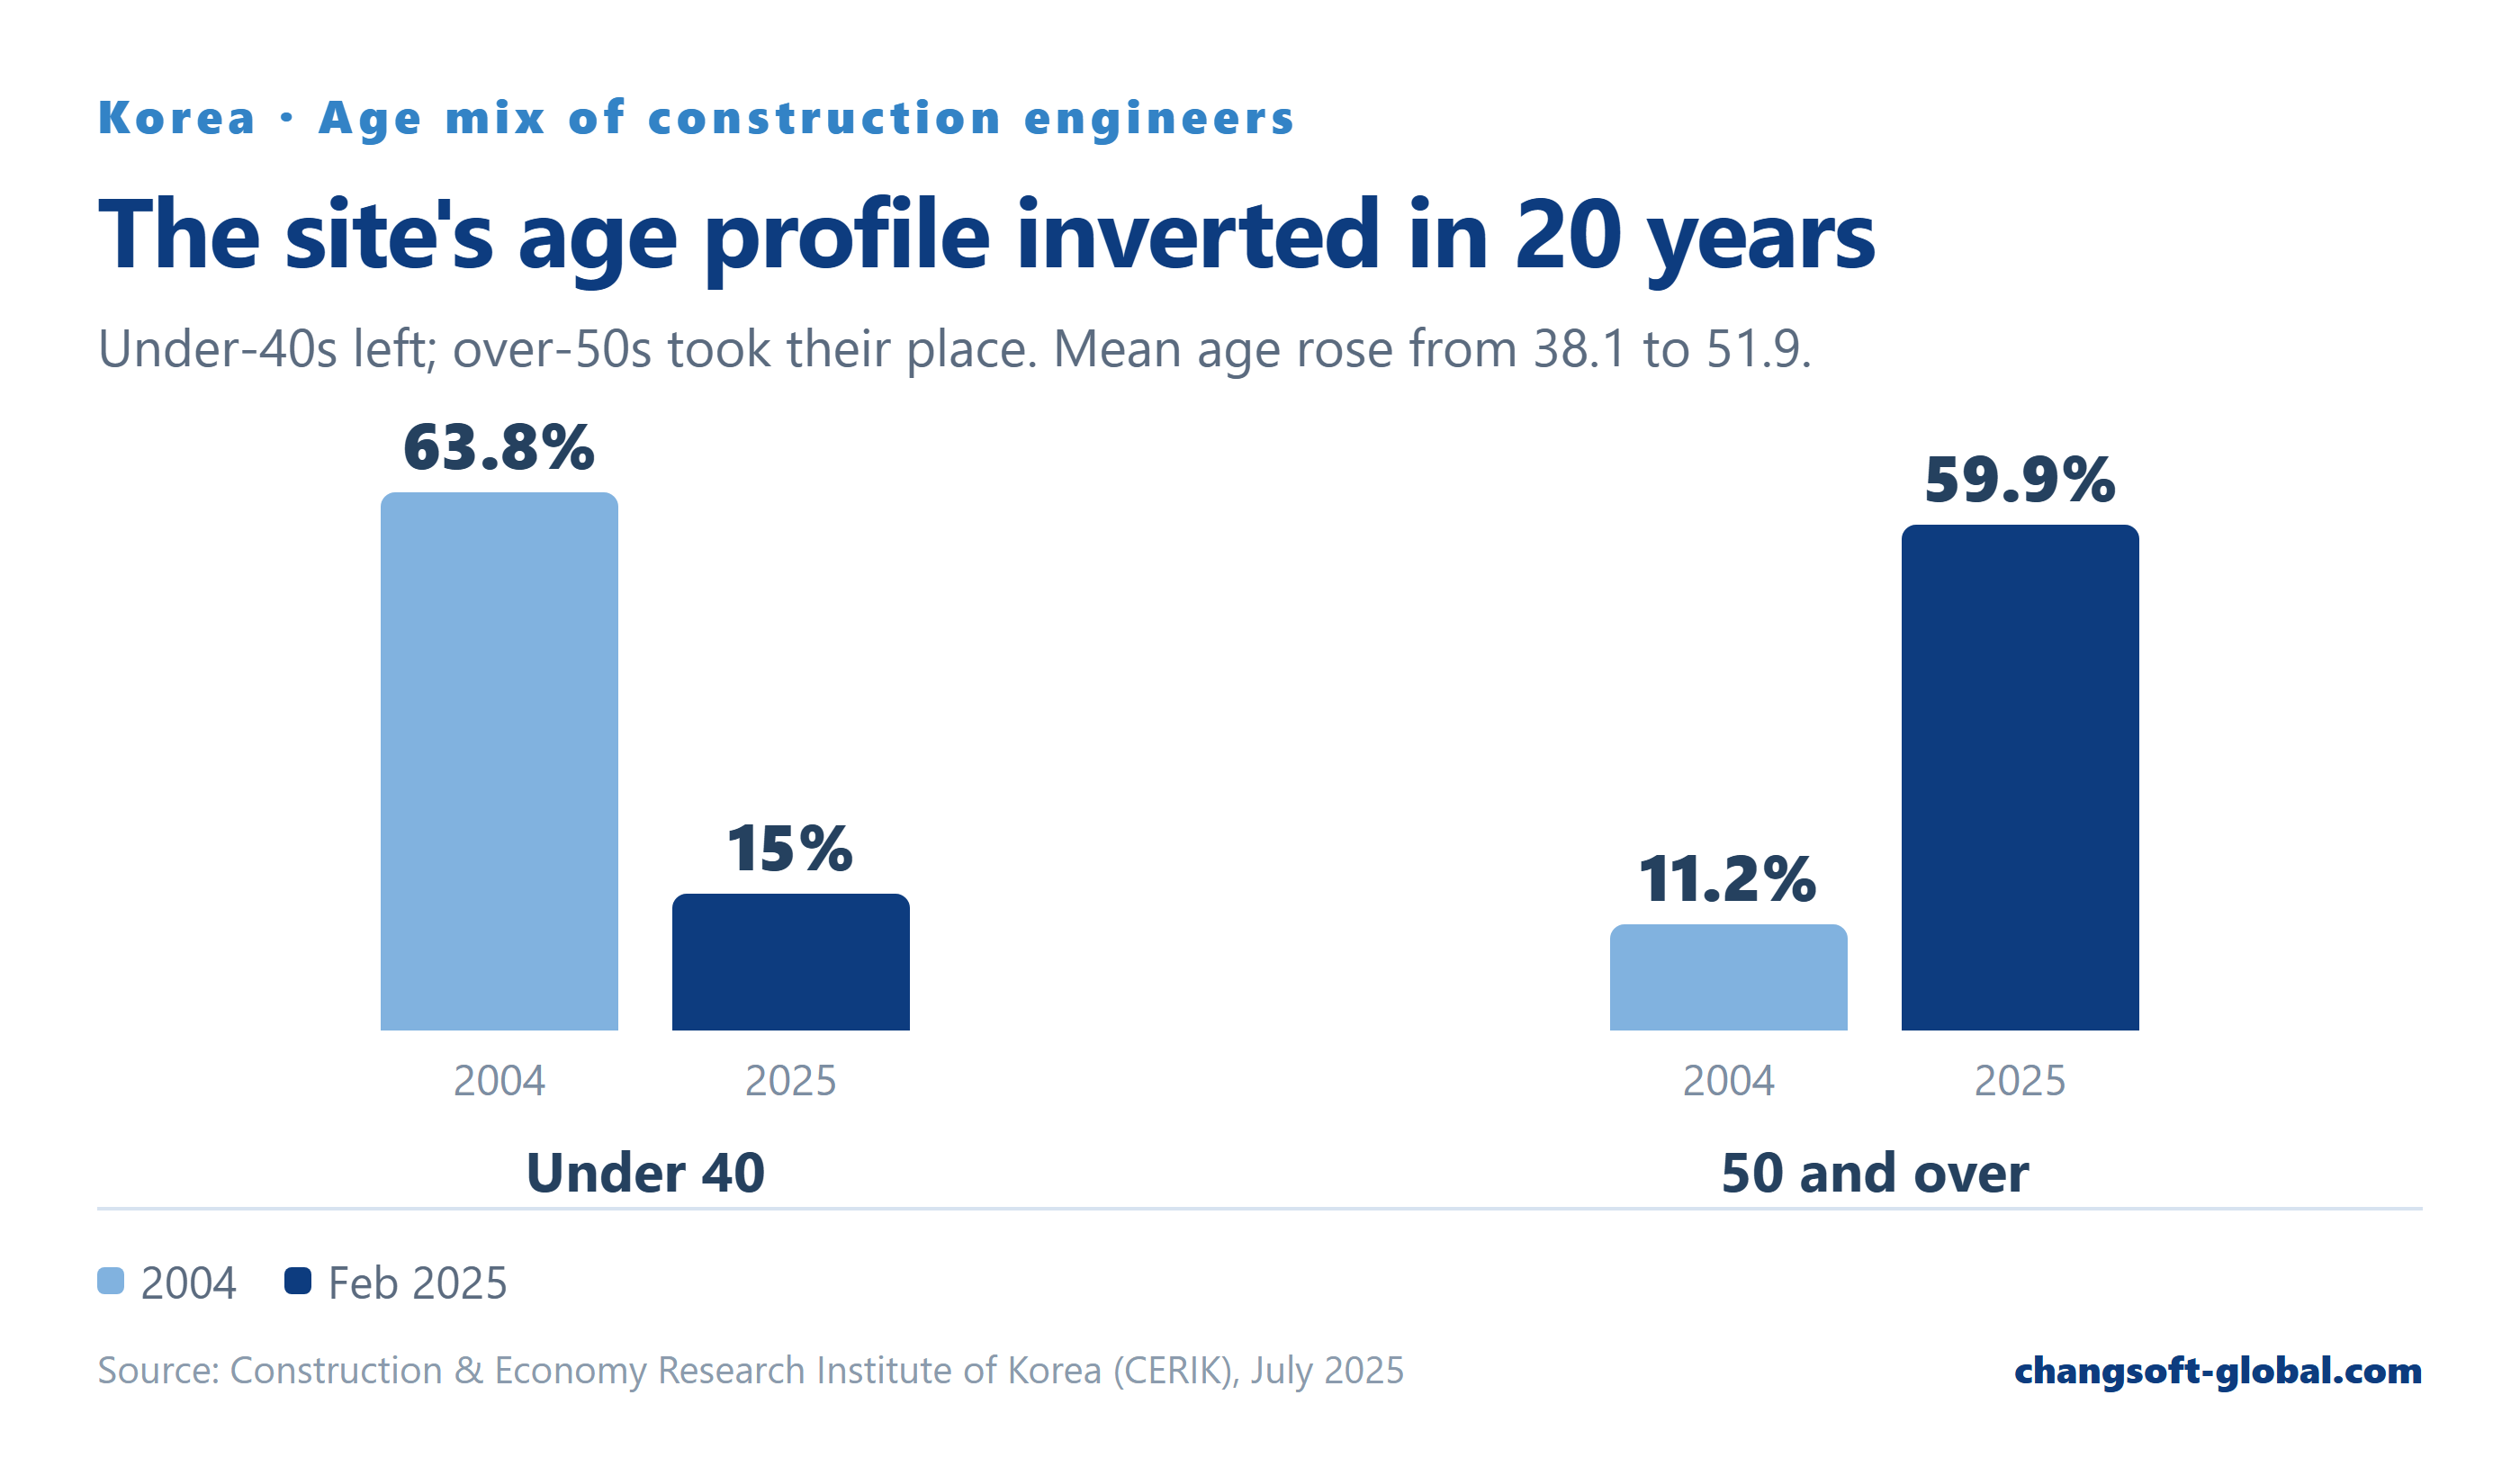
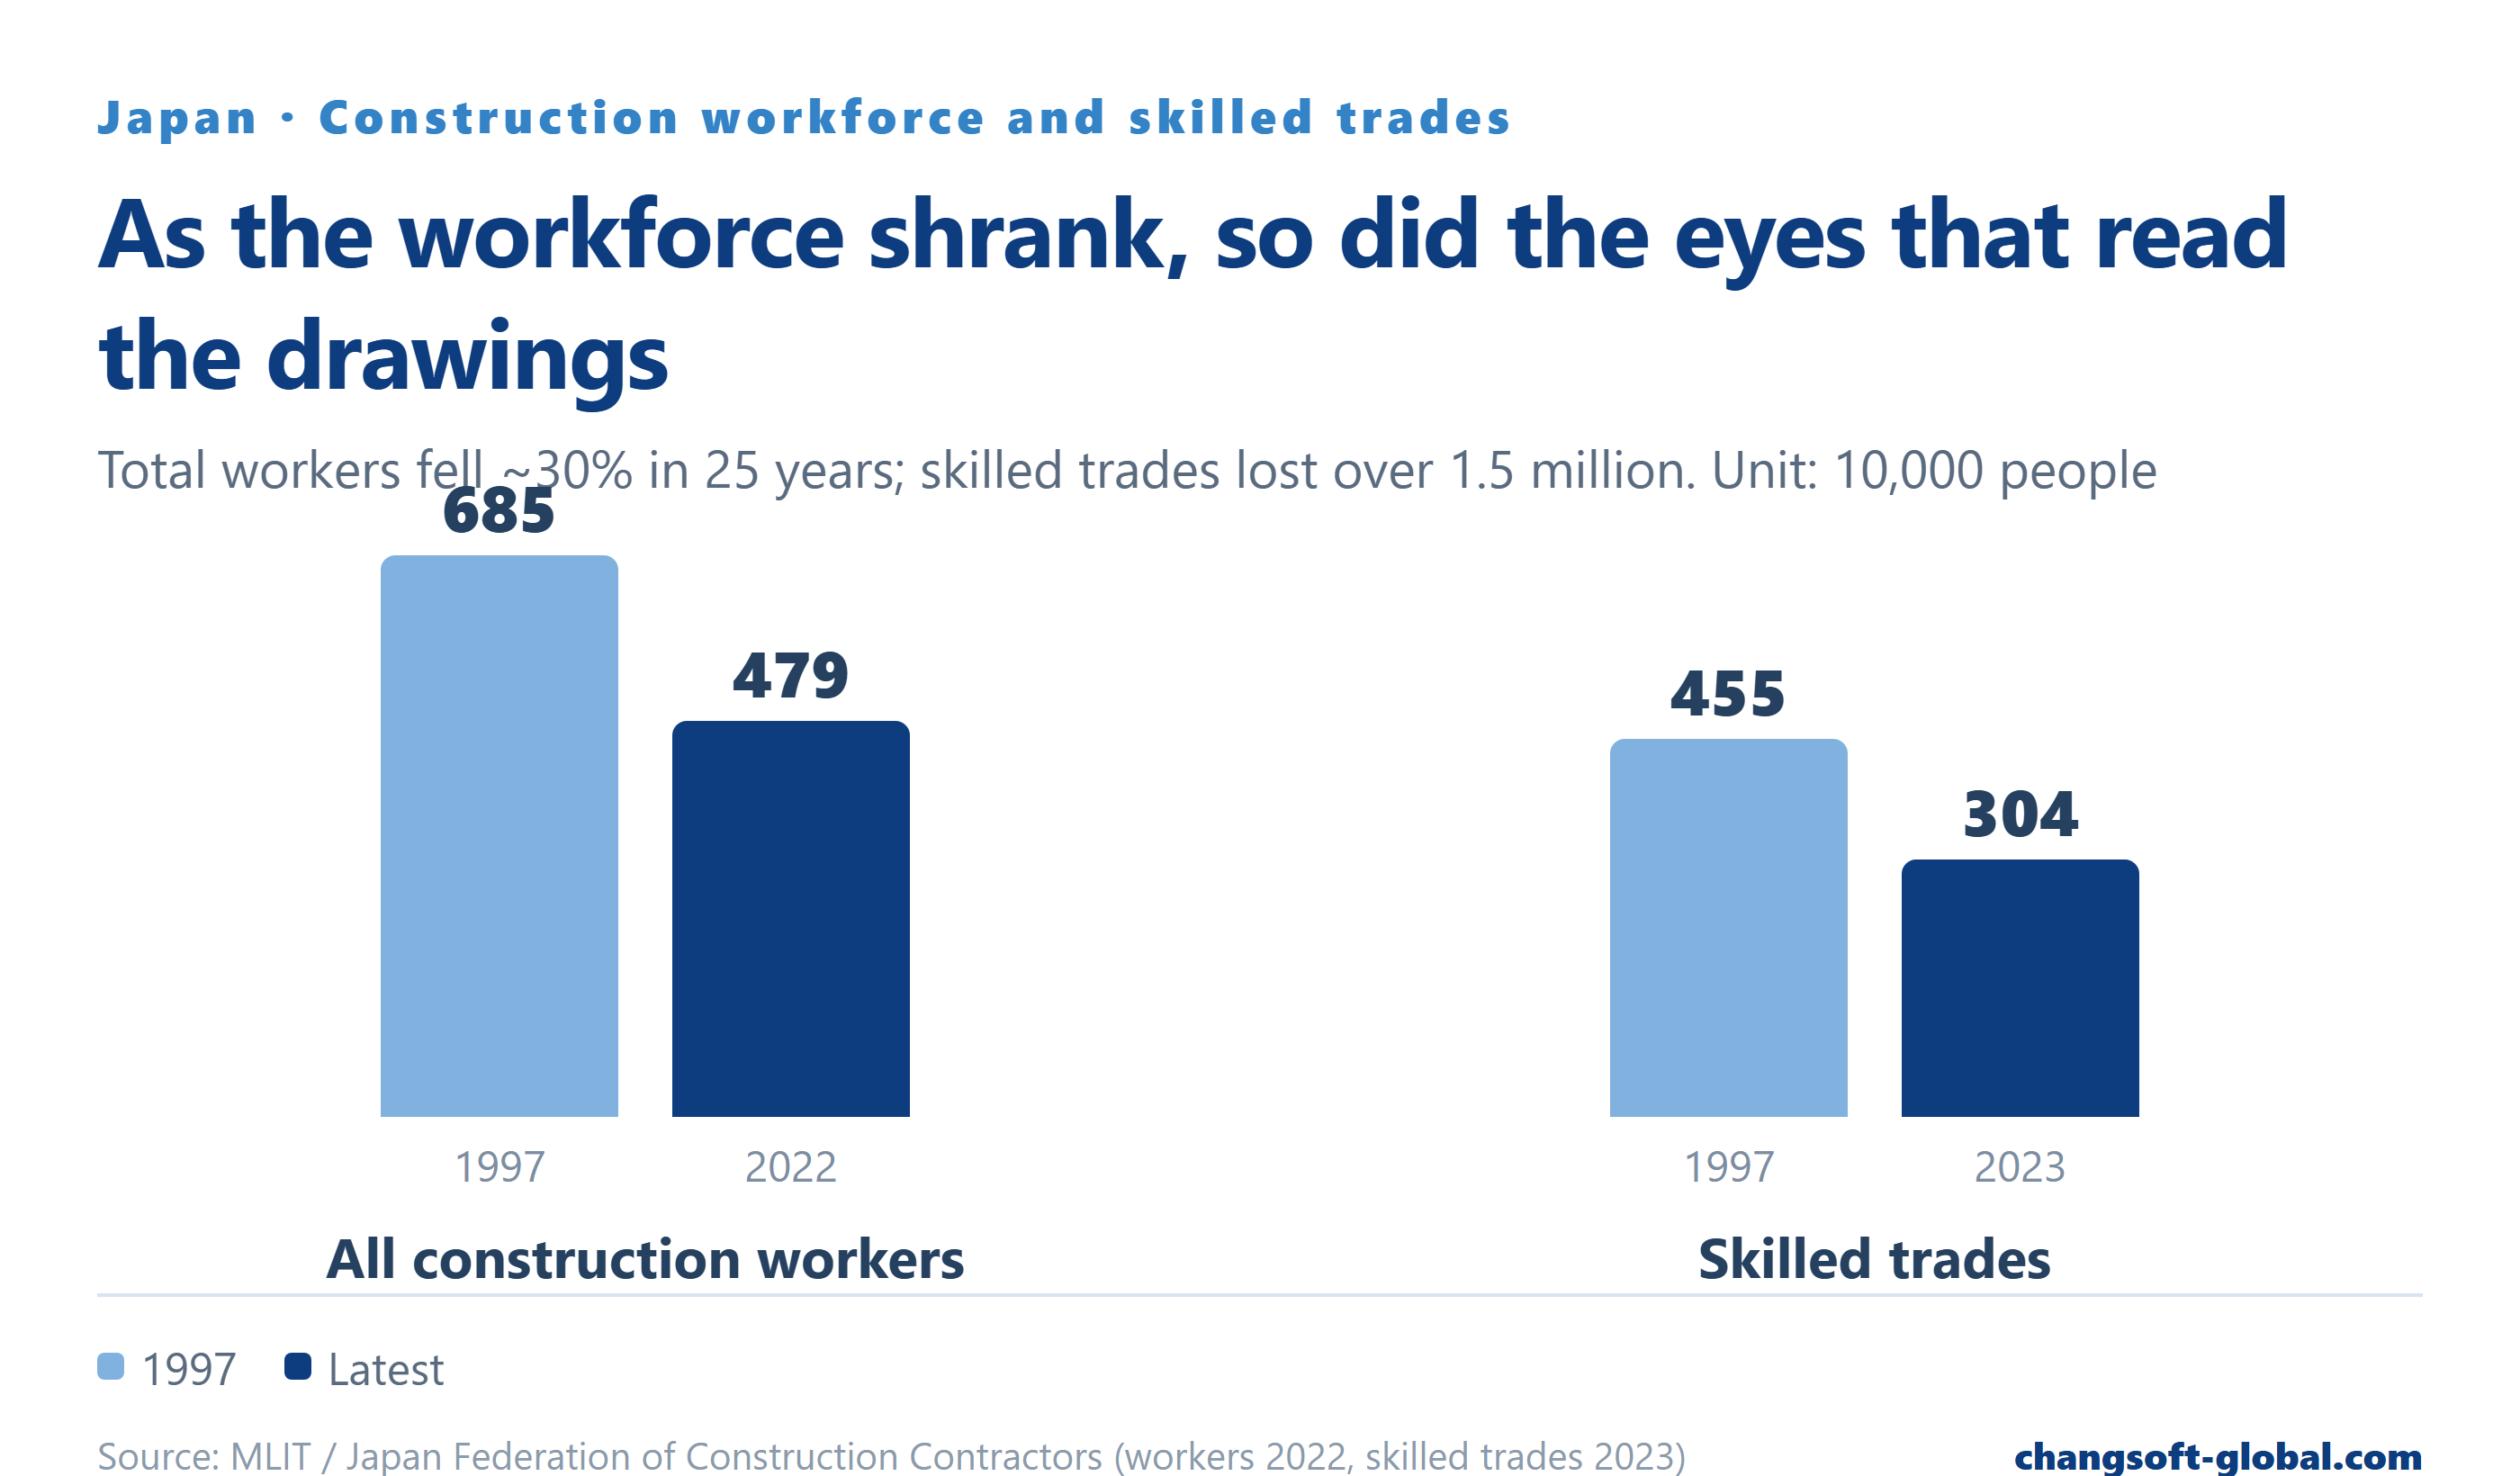
- In Korea, engineers under 40 fell from 63.8% (2004) to 15.0% (2025); in Japan, construction employment fell from 6.85M to 4.79M
- As experienced staff leave, the first thing to wobble is reading a drawing written in symbols — and when notation and geometry disagree, the eye follows the geometry
- Rework runs 5–9% of project cost, and the cost of fixing an error rises roughly tenfold at each stage
1What is shrinking fastest is people
Construction's workforce problem is no longer a forecast; it is a measured condition. The shape of the numbers differs by country, but the direction does not.
Firms reporting hiring difficulty
92%
AGC of America · NCCER workforce survey, 2025 — 1,342 responses
Japan, construction employment
-30%
6.85M (1997) → 4.79M (2022)
Japan, workers aged 55+
36.6%
Under 30: 11.6%
In Korea the composition itself inverted. The mean age of construction engineers rose from 38.1 in 2004 to 51.9 by February 2025, and the age mix changed like this in twenty years.
In Japan the decline started earlier. Construction employment fell from 6.85 million in 1997 to 4.79 million in 2022, and skilled trades from 4.55 million to 3.04 million.
2It is not only hands that are disappearing
Discussions of the labour shortage usually count the hands that build. Something else is leaving with them: the eyes that read the drawings.
A structural drawing speaks in symbols. One dot means one bar; one tag means “this dot is a bundle of two.” That convention becomes information only once a reader interprets it. For a long time that interpretation sat with experienced site staff — look at the notation, build the geometry in your head.
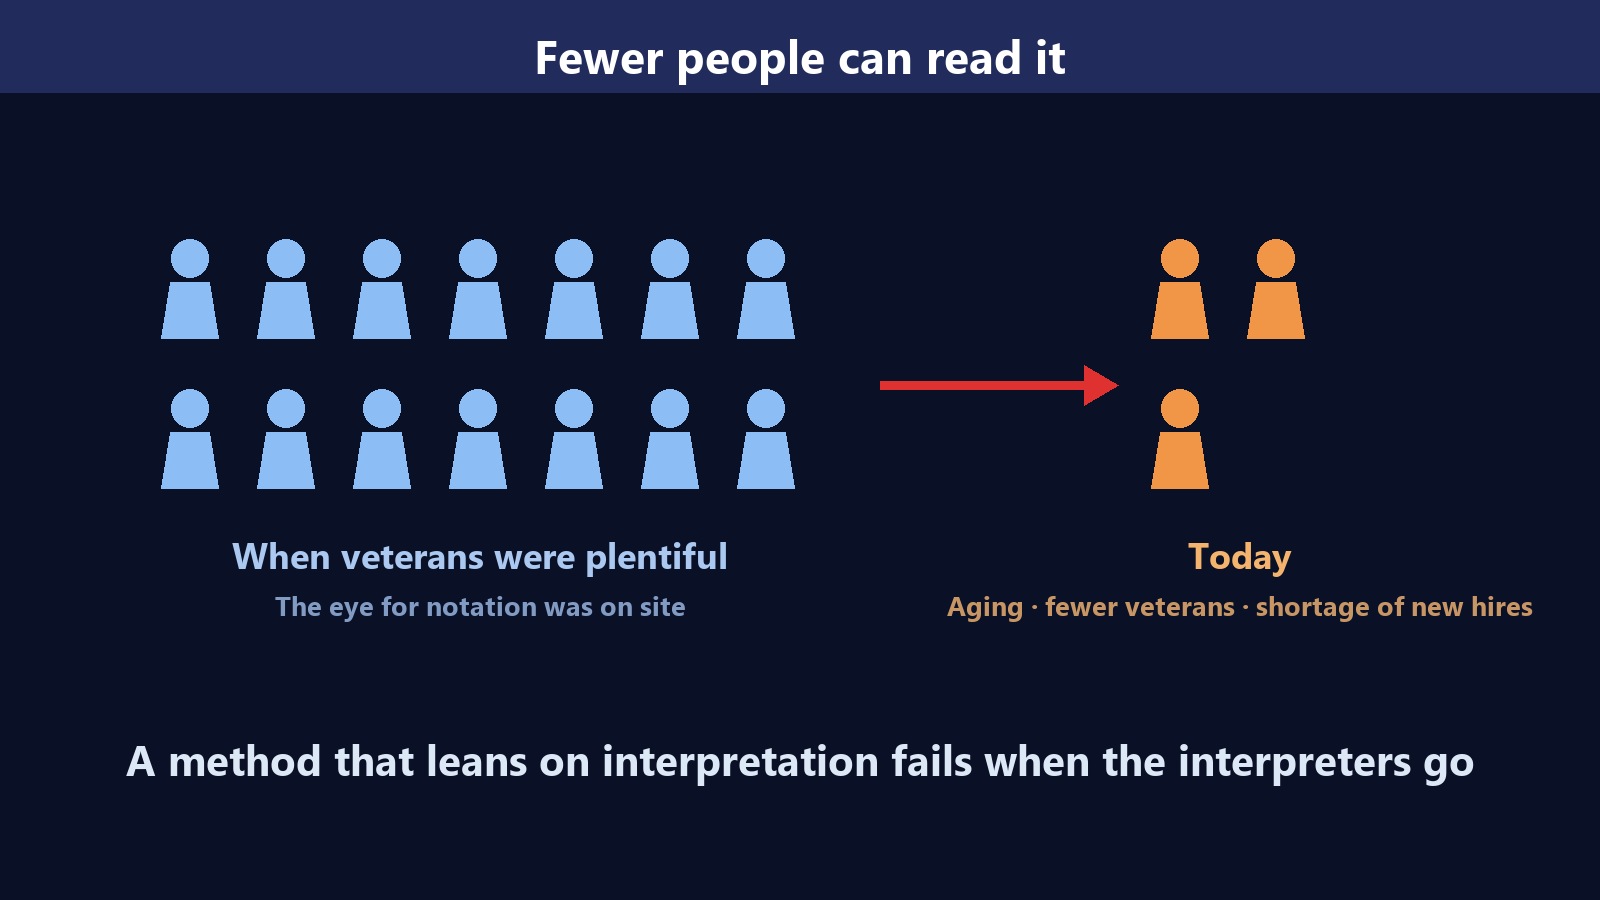
A drawing works properly only while there are people who can read it.
That premise has started to wobble in the statistics — which is where this article begins.
3One scene — same content, different notation
That is abstract, so here is one scene. In 2026 it became public that column reinforcement at a large infrastructure site in Korea had fallen short of the design requirement. What public reporting establishes: of 80 platform columns on basement level 5, 50 did not meet the requirement, and the missing reinforcement came to 178 tonnes.
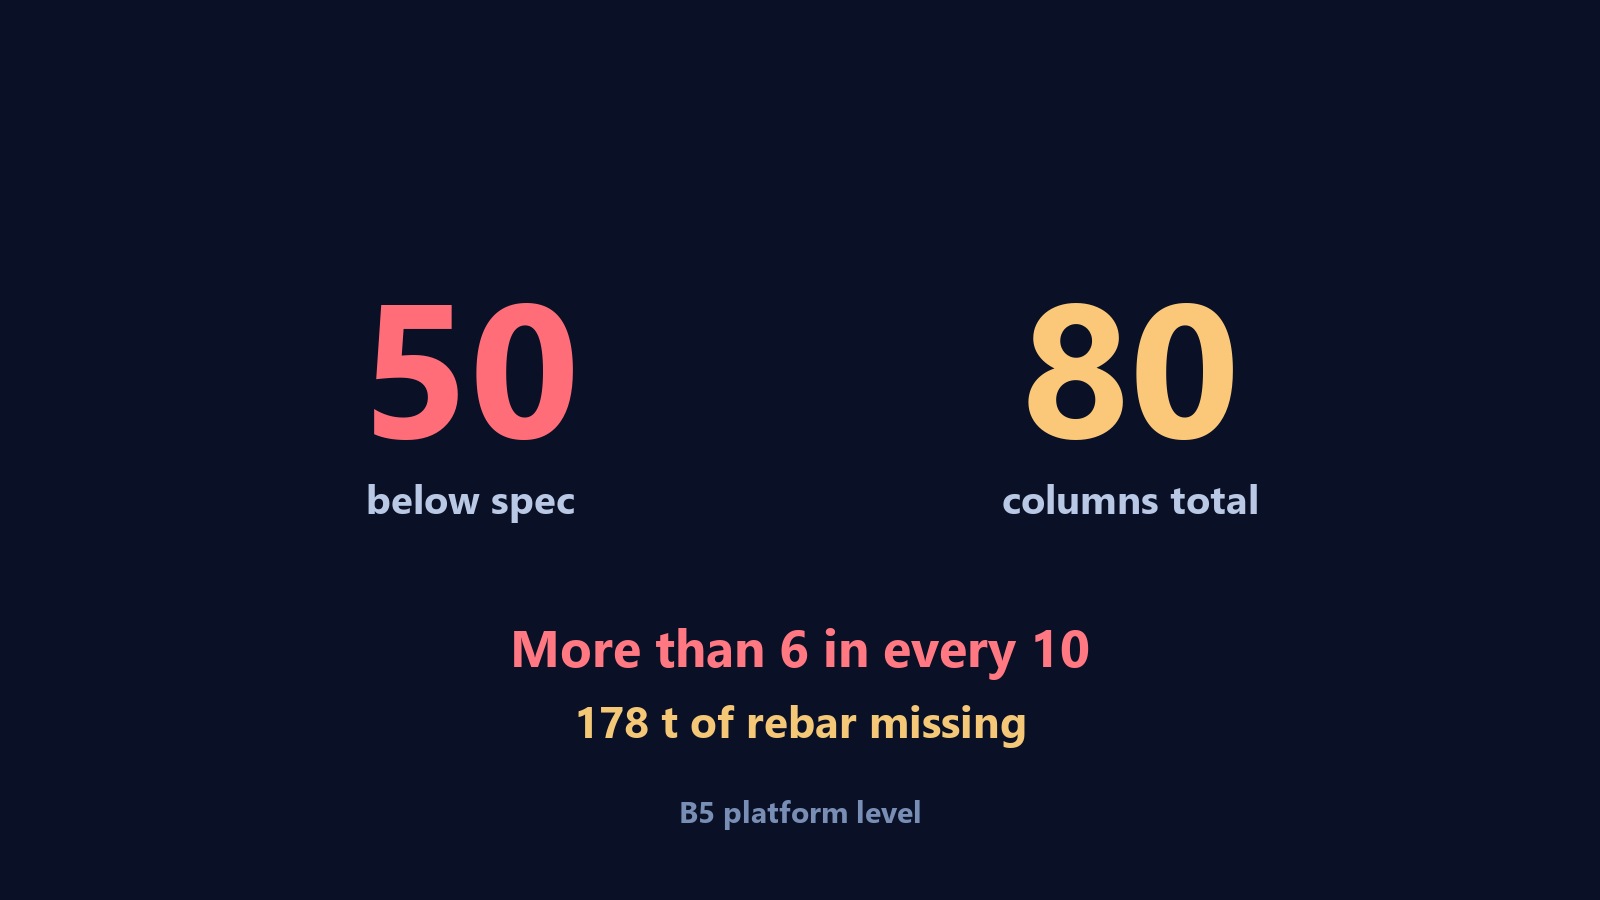
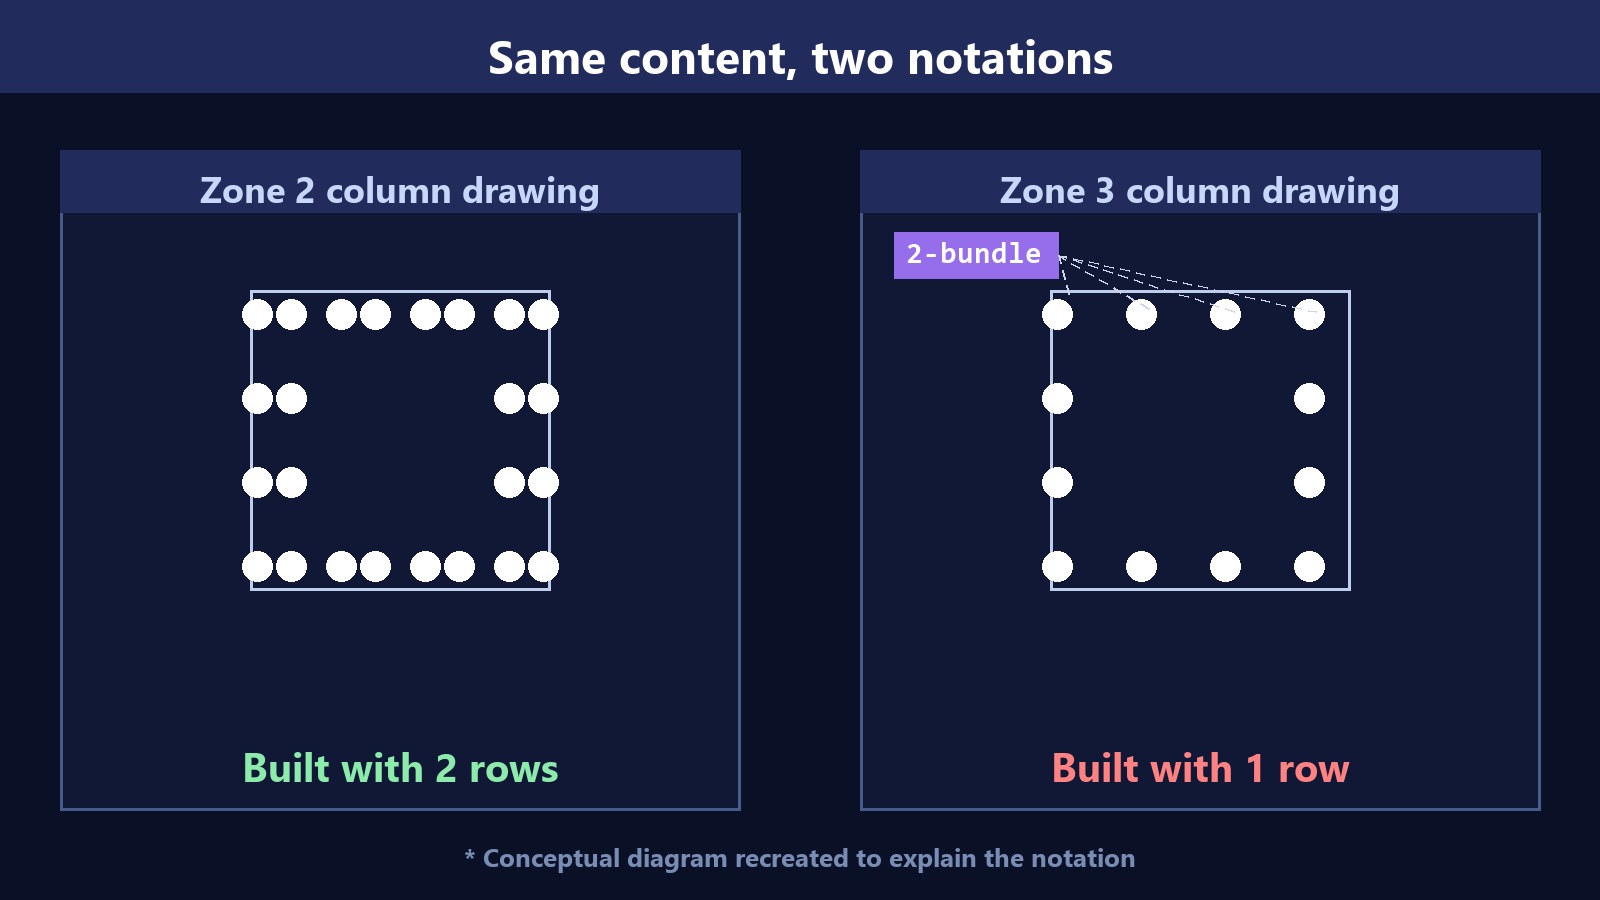
What matters is not the scale but the nature of the cause. The drawings for the two work sections carried the same content, expressed in two different ways. One said it as geometry — two rows of dots. The other said it in text — one row, plus a tag and a leader line.
4The notation was not missing
This part matters. The notation was there. The tag was there, the leader line was there, and the drawing followed the rules.
The problem is that the text and the picture were saying different things. The picture shows one dot; the text says that one is two. Both are correct — but what the eye takes in first is the picture.
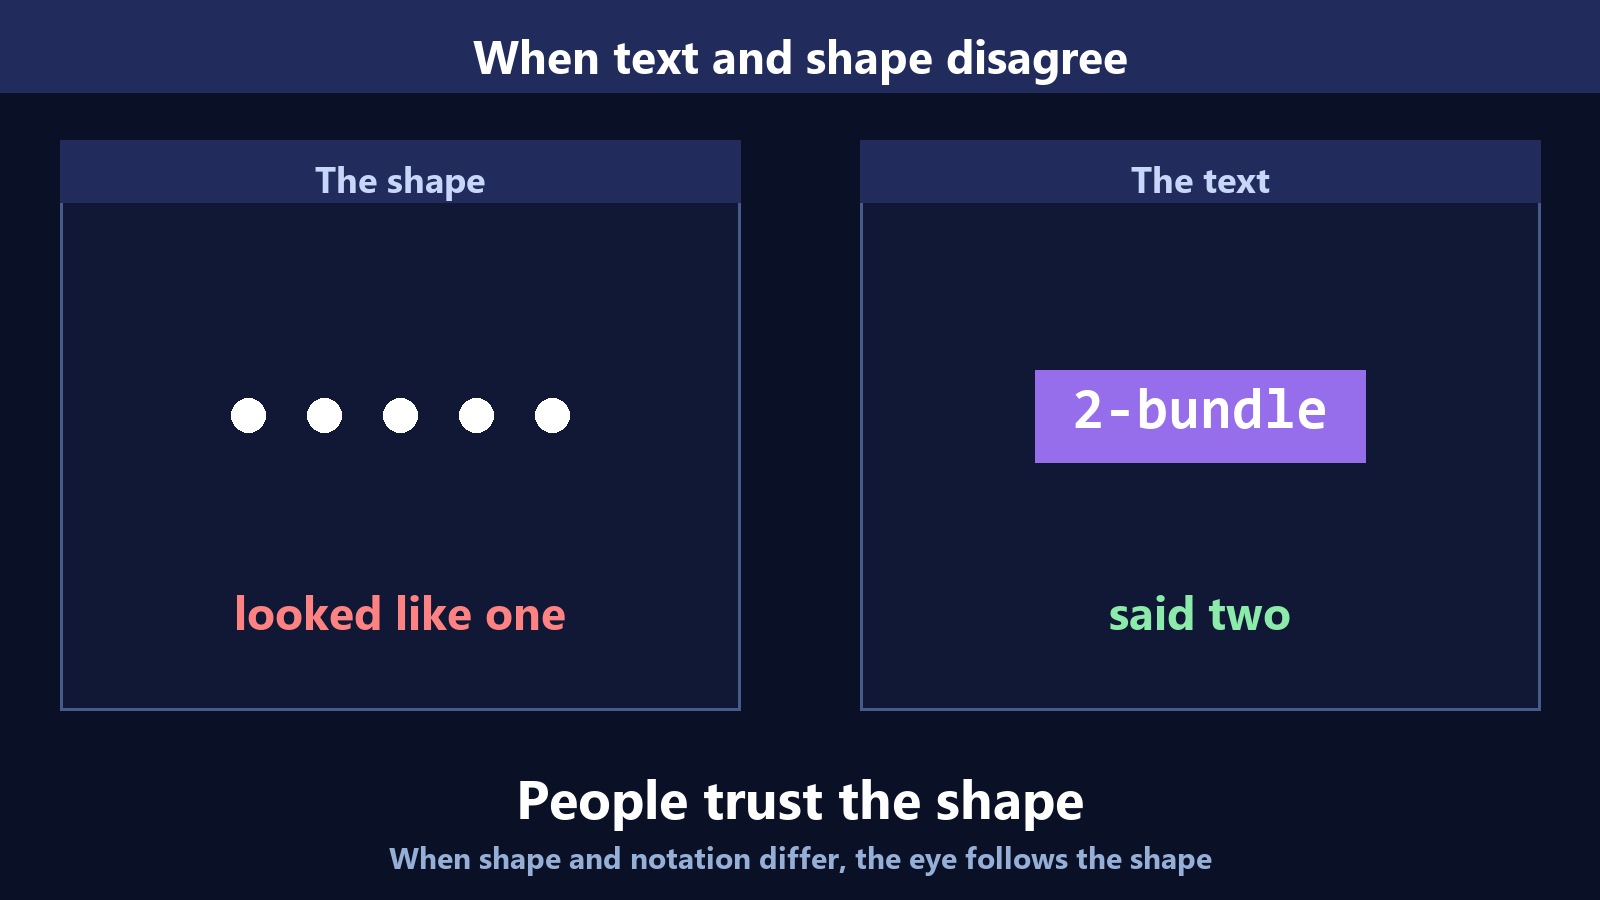
People believe the picture. A method that only works once the notation is interpreted cannot catch that divergence by itself.
Because the drawing was read that way, the material was ordered to match. The divergence had already begun before anyone placed steel. And once concrete covers it, the inside is not visible.
5Japan has seen the same kind of divergence
If this were one country's or one company's problem, there would be no reason to write about it. Construction departing from the design documents has recurred in Japan too.
In 2019, defective construction across a large portfolio of residential buildings in Japan led to an external investigation committee report. The core finding was that what the design documents specified and what was actually built were different, and the number of affected buildings ultimately reached the tens of thousands.
Japanese shop-drawing practice reports the same pattern. The most commonly cited site problem is “built exactly as drawn, and it still doesn't physically fit,” and the cause most often named is insufficient drawing review before construction starts. A 2D drawing is planar, so errors in three-dimensional geometry and congested areas are structurally more likely to pass through it.
6A divergence gets more expensive the later it is found
Why timing matters is something industry-wide data answers. Rework has been studied for decades, and the figures fall in these ranges.
Rework, share of project cost
5–9%
Common estimate range in CII-lineage research
Design-originated errors and omissions
1–9%
Drawing omissions, inaccurate drawings, late design changes
Each stage it survives
~10×
A fix costing 100 in design costs 1,000 in construction and 10,000 after handover
What decides the size of the problem is not the problem but when it is found. Caught at the drawing stage it is one coordinate; caught after the pour it is people and schedule moving together.
7Geometry has no notation system
Here is our part of the argument. A 3D reinforcement model has no notation system. Two bars are two bars, in place. No tag, no leader line, no step where someone has to decode it.
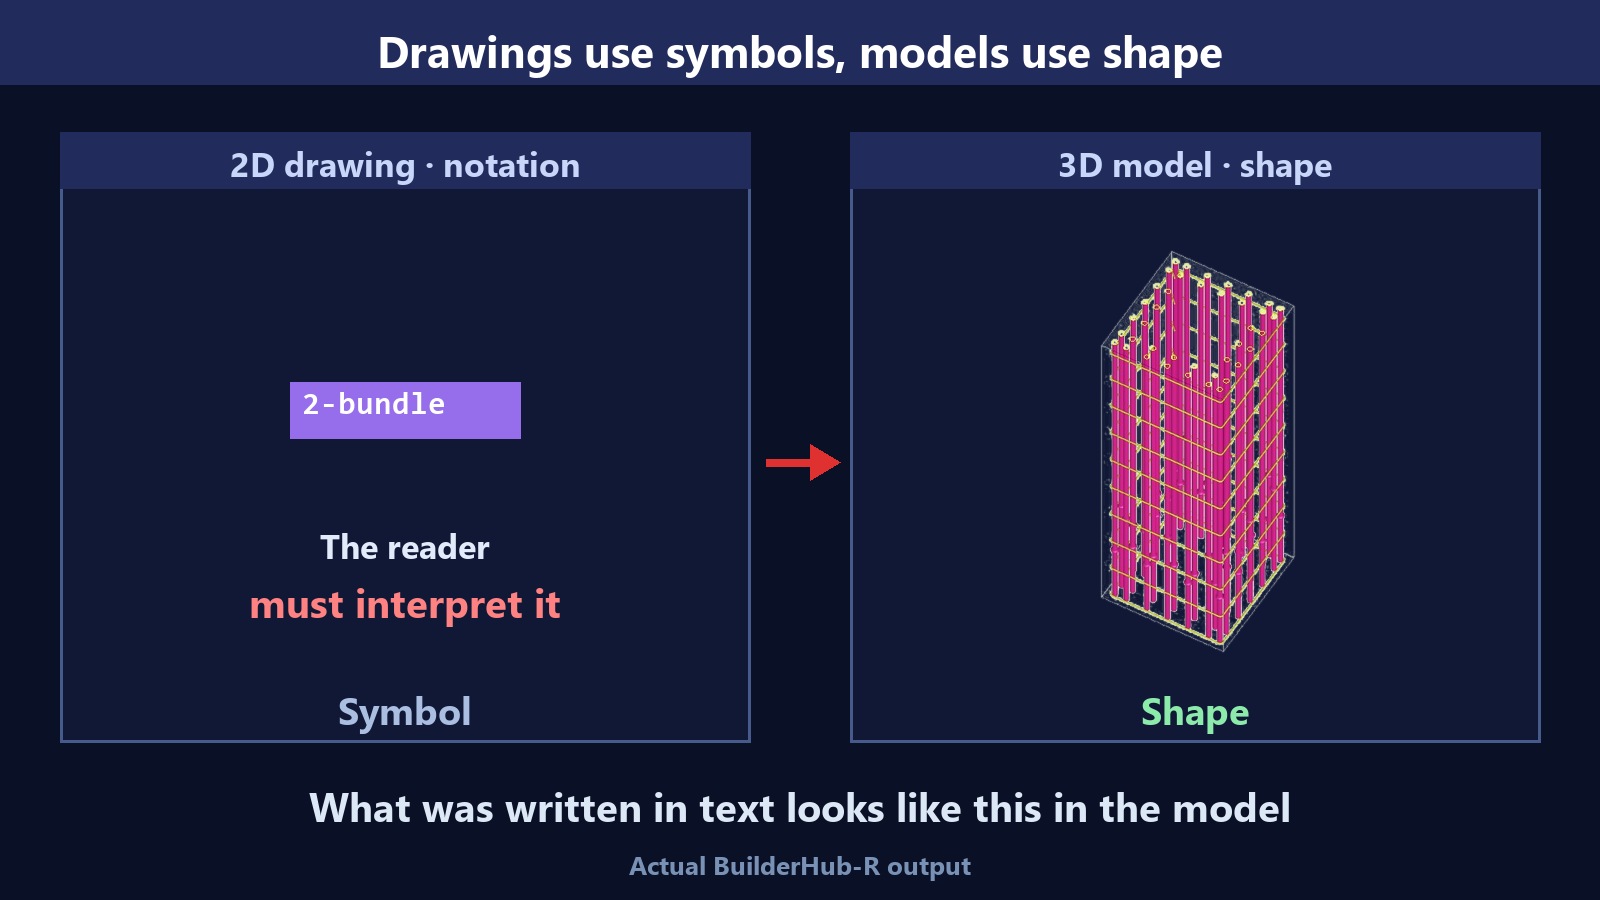
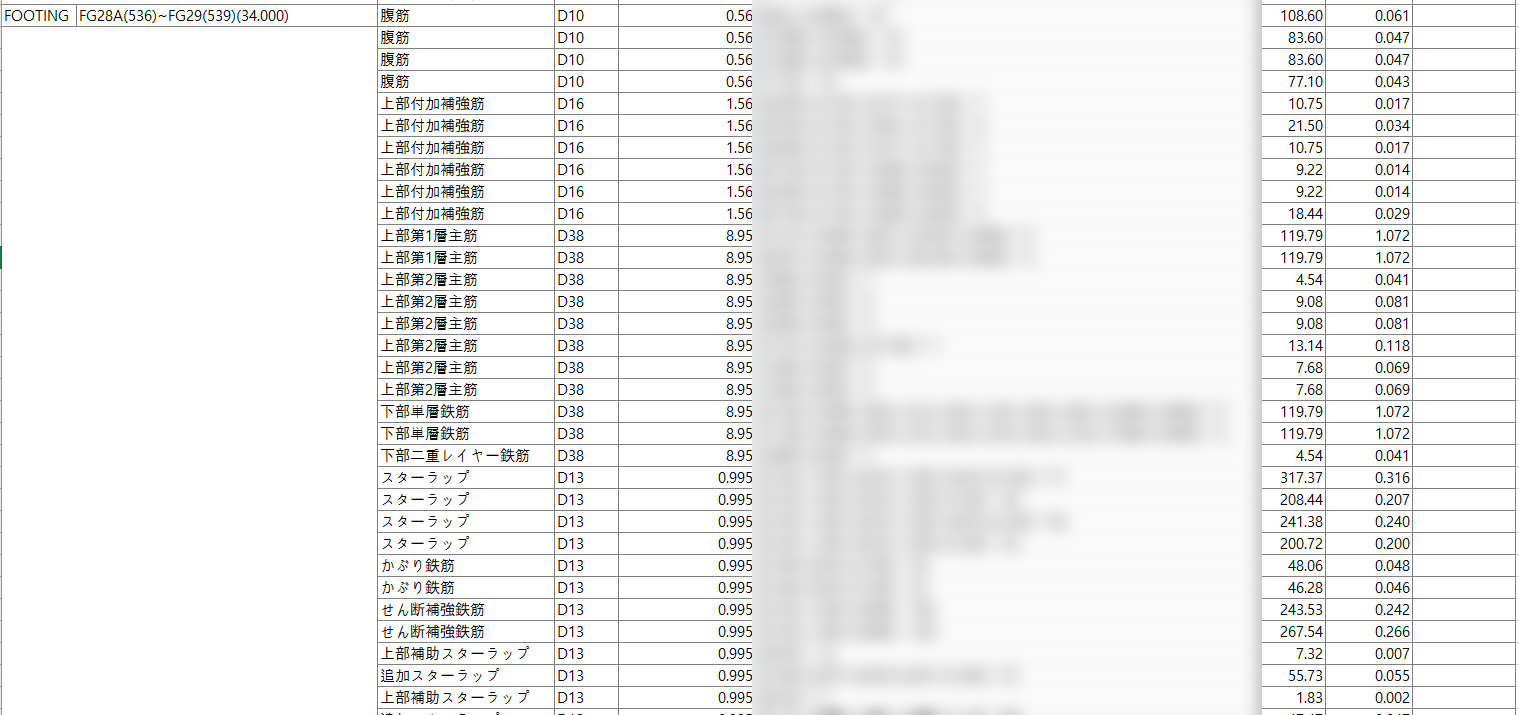
And reinforcement that exists as geometry gets counted. How many bars went into each member stays in a table, and that table can be set against the quantity ordered — one more check that is number against number rather than a person against a drawing.
8And who builds that model?
The obvious objection follows: “Fine, model it in 3D — but doesn't someone who knows rebar detailing still have to build that model?” A fair point. In a general BIM tool the tool produces the 3D and a person decides the reinforcement — which only moves the bottleneck.
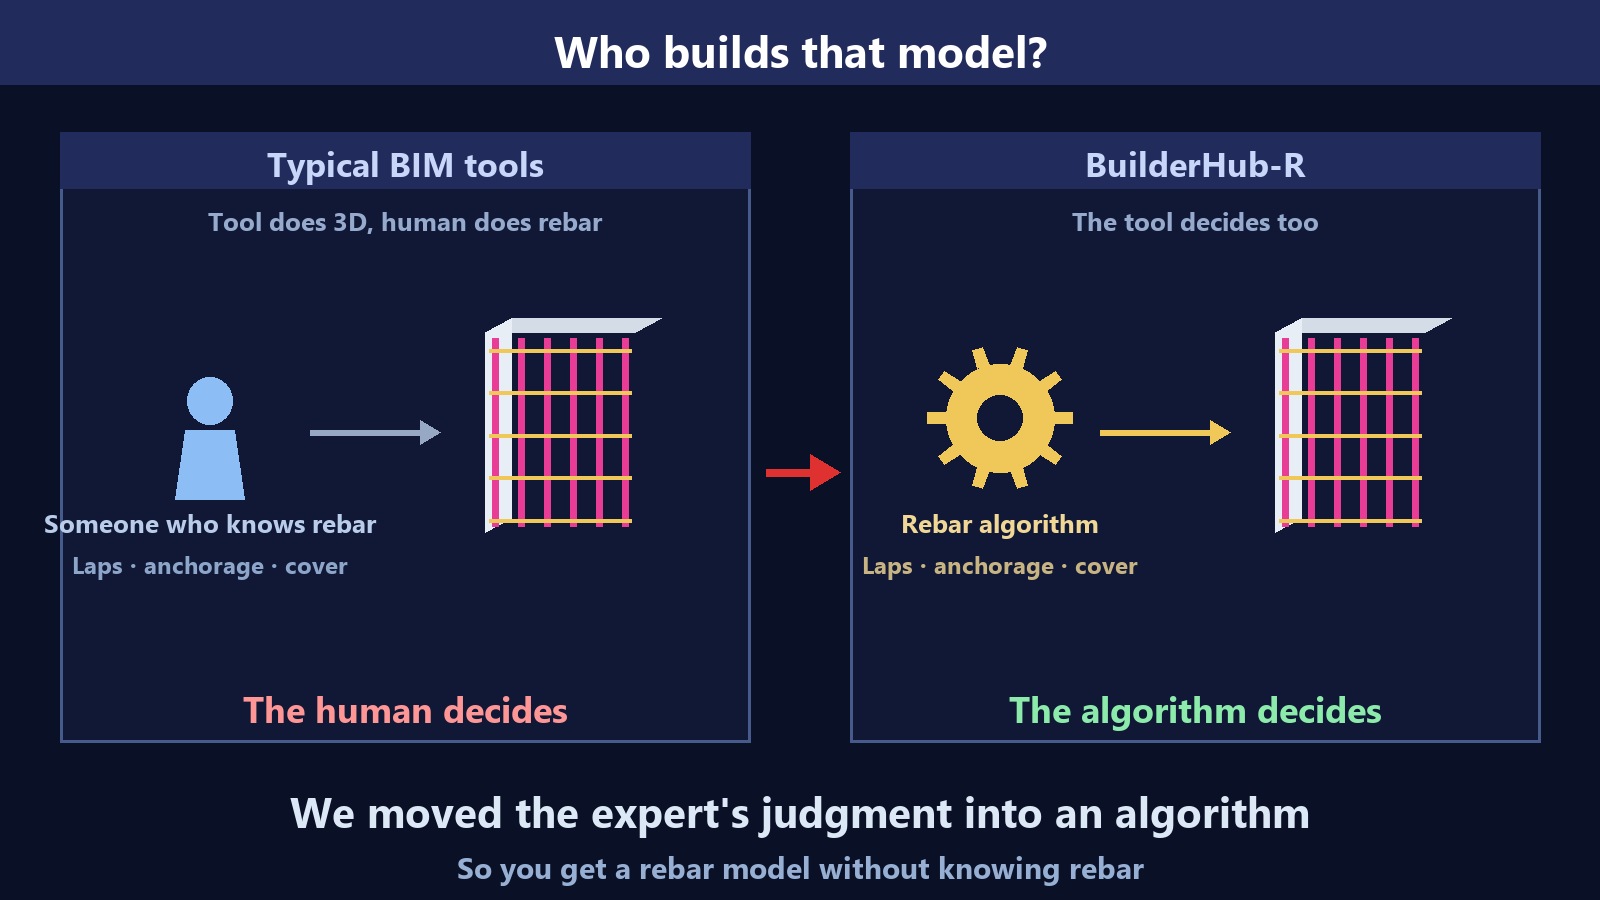
And once those decisions are logic, they stay with the company. Rules that lived only behind an experienced pair of eyes become data, and the result no longer changes with the person.
9Which is why DX has become urgent
Japanese policy documents frame this explicitly as a demographic problem. MLIT's i-Construction 2.0 takes as its premise that the working-age population falls from about 75.09 million in FY2020 to about 62.13 million in FY2040 — roughly 20% — and sets the response as cutting site labour requirements by at least 30% by FY2040, i.e. 1.5× productivity.
Japanese firms using BIM
58.7%
MLIT survey, FY2024 — up 10.3 points on the previous survey
ICT-designated public civil works
89%
FY2024
FY2040 target
1.5×
At least 30% less site labour = 1.5× productivity (i-Construction 2.0)
Put the numbers side by side and the direction is clear. Fewer people, the same work to build, and a policy that says the gap will be closed by automation. Against that, a process that keeps assuming a skilled reader of notation gets harder to sustain every year.
10What this article does not claim
Plainly, then:
- We do not claim our product would have prevented this. A model you don't look at changes nothing. A tool creates the opportunity to check; it does not do the checking.
- We pass no judgement on safety, remedial work, or responsibility in the case cited. Verification belongs to specialist bodies, and experts differ.
- Figures are quoted only as far as public statistics and reporting establish them. No company, site or client is named.
There is one thing we can say. Geometry needs no interpretation. In an era where the decline of experienced readers is visible in the statistics, what is needed is a way of conveying that leans less on human interpretation.
Notation works once it is read. Geometry works once it is seen.
Sources
- 2025 Workforce Survey (92% of firms report hiring difficulty)AGC of America · NCCER
- Trends in construction site technical workforce (July 2025)CERIK
- State of the construction industry — labour statisticsJapan Federation of Construction Contractors
- i-Construction 2.0 (30% less site labour, 1.5× productivity by FY2040)MLIT
- Architectural BIM Promotion Council (BIM drawing review, adoption measures)MLIT
- Investigation report on construction defects (2019, built differently from design documents)External investigation committee (published by MLIT)
- Cost of Rework in ConstructionPlanRadar
- BuilderHub-R product overviewChangSoft Global
This article is a summary compiled from published material. It is not a legal interpretation and does not constitute advice. Regulation changes frequently, so please check the original documents and the latest notices from the responsible authority before relying on it in practice.